
The usual way
- Build a pivot table, then rebuild it when the file changes
- Pick chart types and fix axis ranges by hand
- Paste a screenshot into an email and hope nobody asks a follow-up
Spreadsheet to dashboard
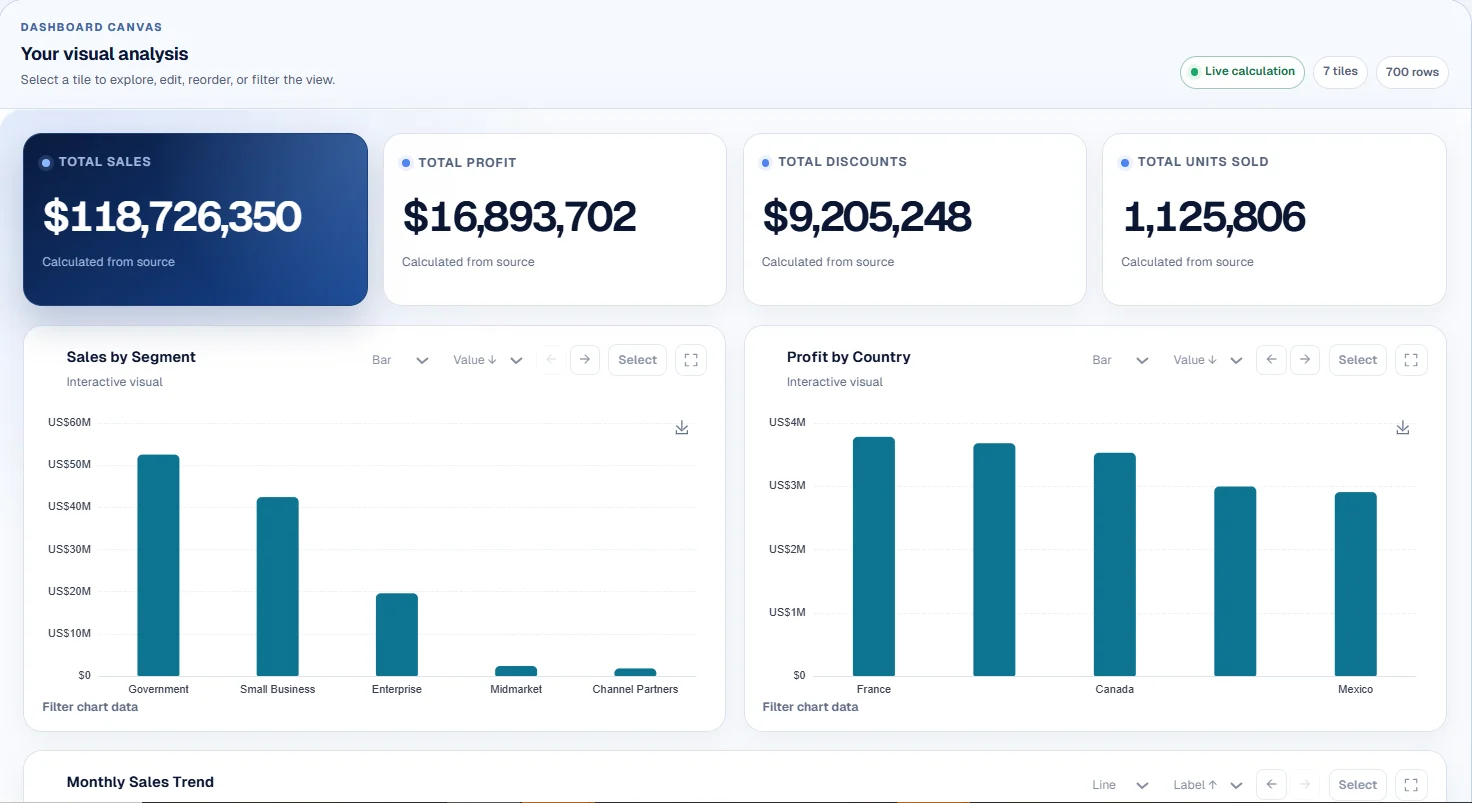
Drop in a spreadsheet and get KPIs, charts, filters and a breakdown table built from your own rows. Every figure is calculated from the file, never estimated, so the totals match the ones you would work out by hand.
What changes
 Photo by Scott Graham on Unsplash
Before the meeting
Every total on the dashboard is worked out from the rows in your file, so when someone asks where a figure came from, the answer is one click away. Filter by any column in the room, answer the follow-up on the spot, and send a read-only link afterwards.
What you get
Totals, averages and counts are calculated from every row of the file, so they reconcile with your spreadsheet to the penny.
Headline KPIs, trends, rankings, filters and a breakdown table, laid out together and ready to present.
Title rows above the header, totals rows at the bottom and multi-sheet workbooks are read correctly without you tidying them first.
Type a question about the dashboard and get a plain-English answer grounded in the figures on screen.
How to do it
No formulas, no templates to set up. Describe what you need the way you would to a colleague.
Upload a CSV or Excel file, or open one of the ready-made samples if you want to see a result before using your own data.
Name the measure, the grouping and the period. Mention anything to leave out, such as cancelled orders or internal accounts.
Try typingRevenue by month and region, plus order count. Exclude refunds.
Your KPIs, charts and breakdown table appear together. Use the filters to slice by any column and compare one total against your file to see it match.
Publish a read-only link that can be revoked or set to expire. On Pro, save the whole thing as a Loop and rebuild it on next month's file in one click.
Worked example
The ecommerce orders sample has one row per order with date, product, category, channel, region, units and order value. Open it and ask for order value by month and channel.
No account, no card, no API key.
Questions
Yes. Upload the file and describe the view you want. CTRON Loop reads the rows, works out the measures and groupings, and builds the KPIs, charts and breakdown table for you.
Every figure is calculated directly from the rows in your file, not estimated or written by a language model. You can check any total against your spreadsheet and it will match.
CSV and Excel (.xlsx) files, including workbooks with several sheets and exports that have title rows above the real header.
No. The try page builds dashboards from your own file or a sample with no account, card or API key. A free account lets you keep working within the Free plan allowance.
Yes. Publish a read-only link that you can revoke or set to expire. Viewers see the calculated figures, never the underlying rows.
Bring the file behind your next recurring task and see a real result in the next few minutes.
Build a dashboard from a sample No account, no card, no API key.