
Randomised trials
32,475 had a defined answer, and the engine matched the reference on every one. With that many independent trials and zero misses, the wrong-answer rate is below 0.009% at 95% confidence.
Research
Every figure on a CTRON Loop dashboard is calculated from the rows of your file. We put that to the test against an independent reference calculation, then built two dashboards from real spreadsheets on the live product and checked every total by hand.
Measured on 25 September 2026.
Results
32,475 had a defined answer, and the engine matched the reference on every one. With that many independent trials and zero misses, the wrong-answer rate is below 0.009% at 95% confidence.
Every calculation crossed with every awkward data shape, overall and per group. Zero wrong answers; on its own this supports a rate below 0.893%.
7 answered correctly and 3 correctly refused, with 0 wrong. A refusal is a tile that could not be built safely, such as averaging a text column, so it is left out rather than approximated.
9 answered correctly and 2 correctly refused, with 0 wrong. A refusal is a tile that could not be built safely, such as averaging a text column, so it is left out rather than approximated.
How the test works
A second, deliberately simple implementation of every calculation, written to be obviously correct and sharing no code with the engine. If the two agree, it is because the answer is right, not because they are the same code.
Currency symbols, thousands separators, accounting negatives, percentages stored as text, padded numbers, blanks, placeholders like n/a, and the floating-point cases that trip spreadsheets up.
The randomised trials use a fixed seed (0x5eed1234), so every run generates the same 35,000 inputs and any failure can be replayed exactly. The suite runs on every change to the product.
Calculations tested
A sample of the values fed in
£1,234.561,000(500)12.5% 5 n/atbcblank cellsnulls1e30070.1 + 0.21e-6 beside 1e9-1.5empty columnsunsortedduplicatesReal files, real dashboards
Two spreadsheets uploaded to a CTRON Loop workspace, turned into dashboards on the live site, then totalled again independently in Python from the very same files.
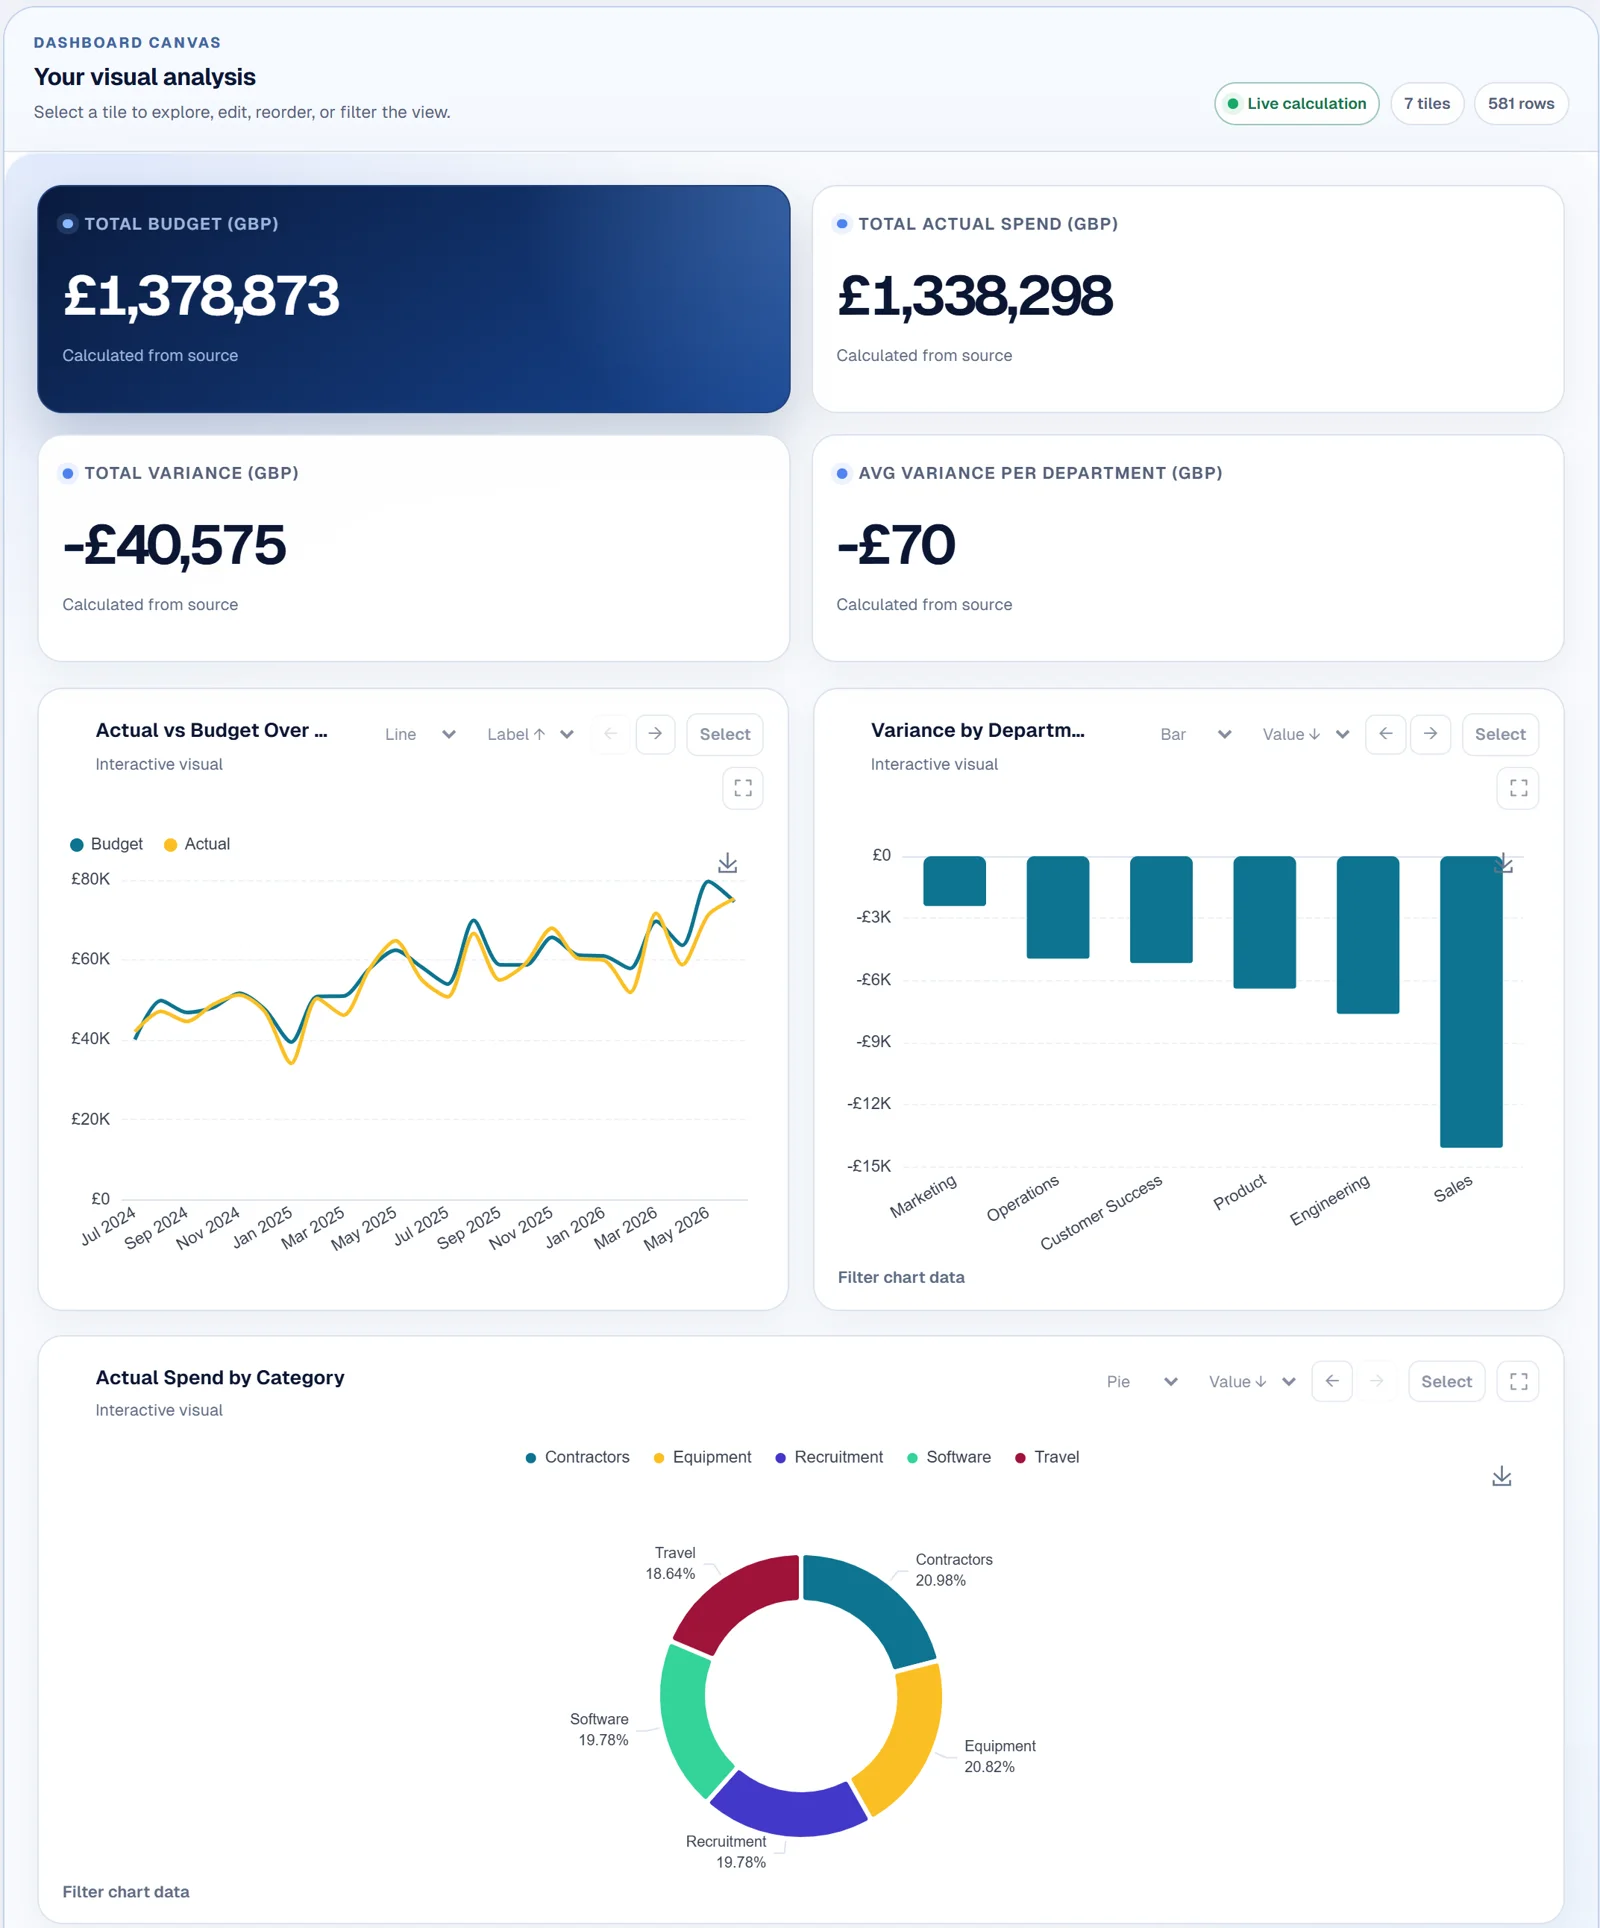
Monthly budget, actual spend and variance by department and category. Dashboard ready in 28 seconds, including reading the file and laying out the view.
| Figure | Dashboard | Independent | Match |
|---|---|---|---|
| Total budget | £1,378,873 | £1,378,873 | ✓ |
| Total actual spend | £1,338,298 | £1,338,298 | ✓ |
| Total variance | -£40,575 | -£40,575 | ✓ |
An Excel export with a title, a note and a blank row above the real header, the way finance systems produce them. Dashboard ready in 31 seconds, including reading the file and laying out the view.
| Fall App Inc. Payroll Summary | |||
| Period: July 2024 to June 2026. Prepared by Finance. | |||
| Month | Department | Location | Gross Pay (GBP) |
| 2024-07-01 | Engineering | Manchester | 3583 |
| 2024-07-01 | Engineering | Remote | 4434 |
| Figure | Dashboard | Independent | Match |
|---|---|---|---|
| Total gross pay | £1,776,634 | £1,776,634 | ✓ |
| Total employer NI | £245,179 | £245,179 | ✓ |
| Total pension | £88,840 | £88,840 | ✓ |
| Total headcount | 436 | 436 | ✓ |
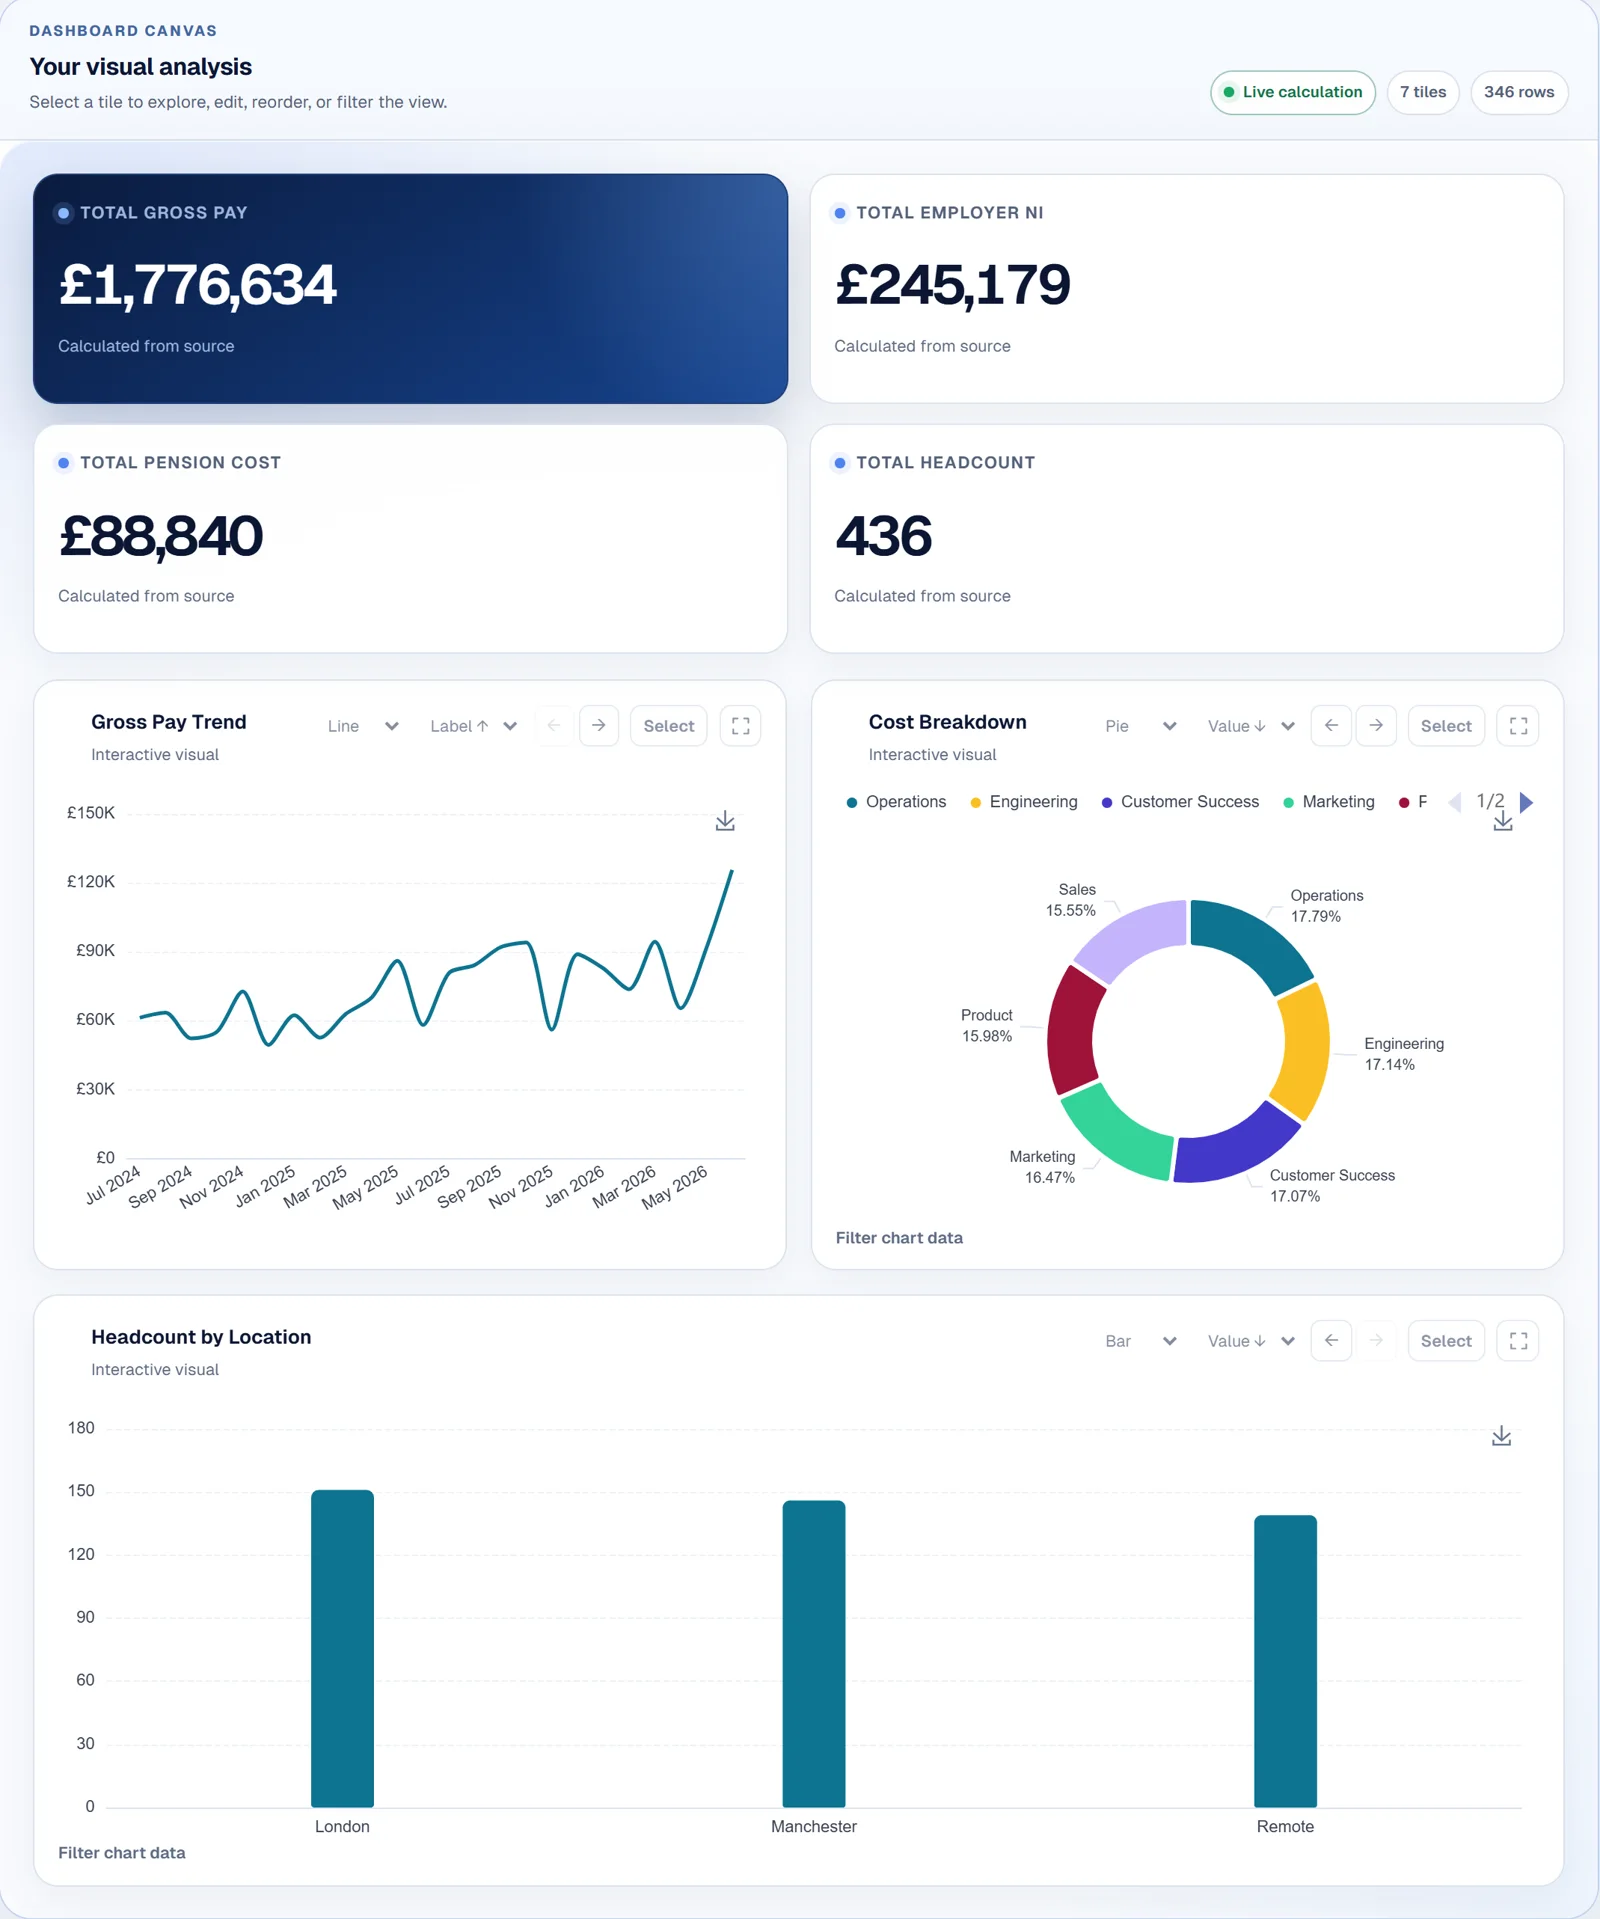
 Photo by Jakub Żerdzicki on Unsplash
Why it matters
Ask a language model to read a spreadsheet and you get an answer that sounds right. For anything financial, sounding right is not the standard. The totals on a CTRON Loop dashboard are worked out from every row, so the figure the board reads is the figure in the file.
What the numbers show
Three traps worth knowing
We test for these on purpose. No calculator can spot them from the numbers alone, because the problem is in what is being added, not in the adding.
A column holding GBP, USD and EUR amounts sums to a number with no real unit. The addition is exact; the question was wrong. Keep one currency per column, or filter to one before totalling.
The plain average of per-store rates is not the overall rate when stores differ in size. Where the file holds the underlying counts, total those and compare them, rather than averaging the rates.
If each row is a monthly summary, counting rows counts months, not orders. Sum the order column instead, or upload the transaction-level file.
Questions
In 35,000 randomised trials against an independent reference calculation, the engine never disagreed. That supports a wrong-answer rate below 0.009% at 95% confidence. Two live dashboards built from real files matched independently calculated totals exactly.
No. Figures are calculated from every row of the file by a deterministic engine. AI is used to lay out the dashboard and explain results in words, never to produce a number.
It uses the rule of three: after n independent trials with zero failures, the true failure rate is below 3/n with 95% confidence. It is a limit supported by the evidence, not a guess.
Yes. Open a sample on the try page, build a dashboard, then total the same columns in Excel. The figures will match.
Open a sample or upload your own spreadsheet, build a dashboard in under two minutes, and compare any total with your file.
Try CTRON Loop freeNo account, no card, no API key.